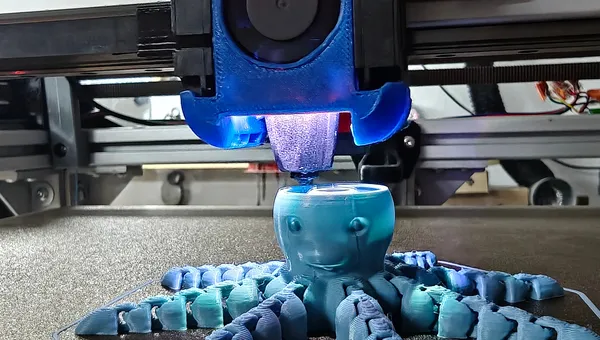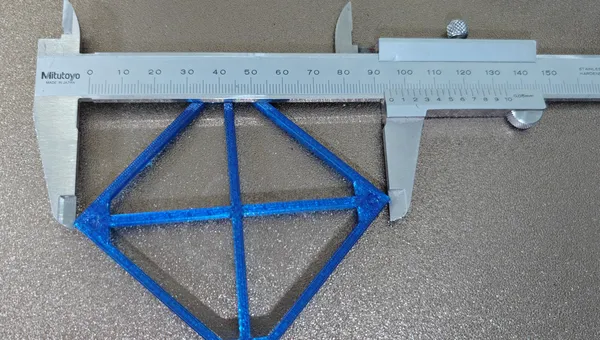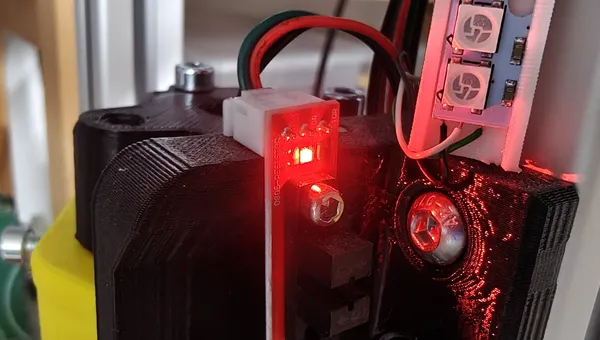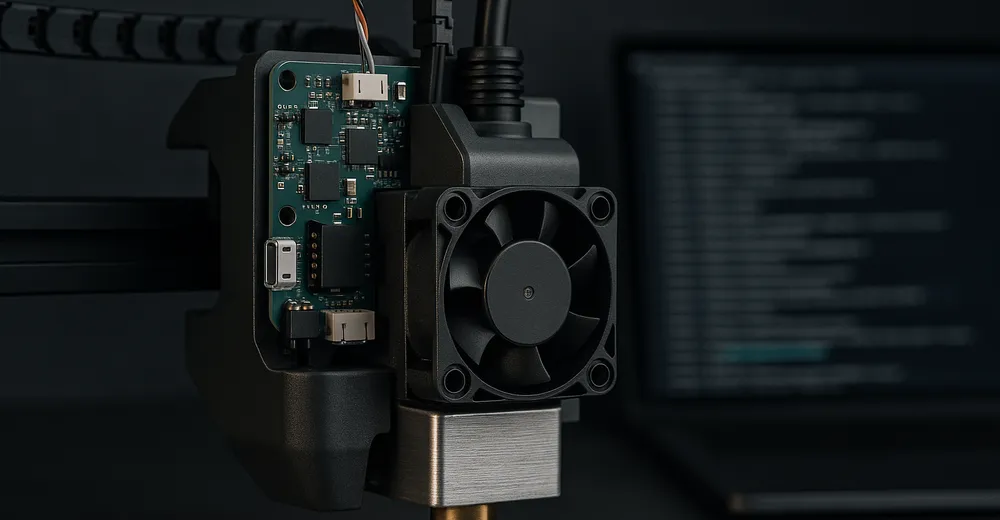
One evening of troubleshooting a 3D printer, and the real yield is not the settings but the mistakes along the way. Two of them are detailed enough to deserve their own sections – the rest follow as a list at the end.
The CAN failure that wasn't one
In the middle of troubleshooting, the toolboard started dropping out: Lost communication with MCU 'toolboard0', eight times over several days of operation. The first send queue I looked at consisted of 96 out of 100 messages of neopixel_update and neopixel_send – the LED effects on the toolhead ran at 24 frames per second, i.e. 48 messages per second over the CAN bus.
That looked like a clear case. I lowered the frame rates to 2 (for effects that display a value) and 6 (for animated effects). Bus load dropped from around 46 to 21.6 messages per second.
On the next homing the board died again.
Only then did I look properly – and first grabbed the wrong statistics. On shutdown Klipper dumps the counters of all MCUs one after another; I had taken the last one in the log, the Raspberry Pi's, and concluded that the connection had been perfectly healthy. The toolboard's lines were four hundred lines further up and said something else.
| Time | Messages so far | Pending | Retransmit | Heater | LED rate |
|---|---|---|---|---|---|
| t = 3088 | 111,667 | 7 | 227 B | off | 44/s |
| t = 12685 | 135,232 | 7 | 209 B | off | 44/s |
| t = 16408 | 3,234 | 7 | 239 B | bed 100 % | 44/s |
| t = 17133 | 2,369 | 7 | 221 B | bed 100 % | 6/s |
Always exactly seven unanswered messages, always around 220 bytes of retransmission. So the retransmissions do not accumulate over runtime – they all occur in the last few seconds. Once the connection survived 135,232 messages, once it died after 2,369. The last dropout happened with the LED rate already halved.
And then the line that decides everything – the CAN controller on the toolboard itself:
canbus_status rx_error=0 tx_error=0 tx_retries=0 canbus_bus_state=activeAn overloaded bus gets slow, but it does not lose a connection silently. If the controller reports “bus active, no errors” and the host still hears nothing for five seconds, the connection did not fail – the board was gone.
This is not a bandwidth issue but a reboot or a hang: a brief voltage dip on the 24 V supply, a crimp in the drag chain cable, or a firmware bug. The toolboard runs v0.13.0-255, the host and the two other MCUs -743 – about five hundred commits apart. At the time of writing, the cause has not been conclusively identified.
I kept the LED reduction anyway. It halved the bus load, which does no harm. It just wasn't the cause – it was what piles up when a board goes silent.
Ad · Affiliate link – if you buy through it, I may earn a commission. It doesn’t change the price for you.

Configuration without effect
While looking for an inexplicable Z offset, I found a line in lineux/btc.cfg that would have explained everything:
SET_VELOCITY_LIMIT ACCEL={move_accel} # move_accel nirgends definiert -> 1000It sat in a toolchanger entry point, was never reverted anywhere, and was the only SET_VELOCITY_LIMIT statement in the entire configuration directory. To me it was clear: the printer ran at 1000 mm/s² instead of 4900 from the start of every print.
That was wrong. The file is never loaded – printer.cfg does not include the lineux/ folder at all. These are leftovers of a toolchanger that no longer exists.
What is annoying is less the mistake than the fact that I had already measured the opposite: toolhead.max_accel was 4900 after a full homing run. That number would have disproved the claim immediately.
Configuration files in the folder are no proof that they take effect. The only reliable source is the running instance – for Klipper, printer.configfile.config via the Moonraker API. The toolchanger sections were simply not in there.
The other five
I changed two things at once
For one print, geometry and bed temperature (70 to 60 °C) were changed together. Afterwards it was impossible to tell what had made the difference. With test prints that each take over an hour, that is particularly expensive.
I didn't believe my own measurement
The measured value max_accel = 4900 was there before I assumed a macro throttled to 1000. When measurement and hypothesis contradict each other, the hypothesis has to go – not the measurement.
I guessed the direction instead of looking for the mechanism
The first layer was too loose, so I wanted to counter it with a babystep down, using a plausible starting value. Only then did I notice that I had never set the displayed offset of +0.1014 mm – so where did it come from? Exactly that question led to the right correction, which was three times larger than my estimated starting value. A number you cannot explain is not a detail to adjust away.
I would have shipped a change that does nothing
An adaptive bed mesh was fully built, dry-tested in all edge cases and syntactically flawless. It would have remained ineffective, because an overriding macro discarded the parameters while reporting ok. Only the test run on the real machine revealed it – no amount of reading my own code would ever have found it, because my own code was correct.
I almost set a tolerance that would have aborted prints
For gantry levelling I initially wanted to use a 7.5 µm residual tolerance. Only Klipper's own comment in the config file – “if you are probing more points than steppers…” – made clear that four probe points with three motors leave a residual that no tilt can remove. Measured, it is 14 to 26 µm. With my first value, Z_TILT_ADJUST would have bailed out with an error after five attempts, in the middle of print start.
What helped in all of these cases was the same thing: looking for a number that could disprove your own explanation, not one that supports it. The CAN case is the cleanest example – the LED hypothesis was plausible, well supported and still wrong. It was not disproved by a better argument, but by a single line with four zeros in it.
But where no disproving number is available, only running it helps. No amount of careful reading could have found the last two points – with the wrapper my own code was correct, and the residual of the gantry levelling is a property of this machine that is not written in any file. Both only showed up once something ran.
Printer: HevORT with BTT OctopusPro, toolboard via CAN, Klipper v0.13.0-743 (toolboard: -255), BTT Eddy USB. Slicer: OrcaSlicer 2.4.2.
All numbers come from klippy.log and the Moonraker API of this machine. The cause of the toolboard dropouts is still open.
This series
One evening of troubleshooting a chain octopus produced four topics that can be read independently:
- Klipper Bed Mesh: A Missing Zero Reference Costs 0.14 mm
- Print-in-Place: Layer Height Decides Whether Joints Move
- OrcaSlicer & Klipper: 34 % Less Print Time
- Seven Fallacies in Klipper Troubleshooting – this article
Ad · Affiliate link – if you buy through it, I may earn a commission. It doesn’t change the price for you.